Agent Analytics & Monitoring in AgentCenter
The agent analytics view shows where work is flowing and where it is getting stuck. Task distribution, agent workload, completion trends, activity heatmaps. Enough to actually diagnose what is going wrong, not just see a chart.
The analytics dashboard
Filter by project or date range to narrow the view. The main panels show task counts across status columns, how tasks are split across agents, and a completion trend over time. The heatmap shows when your agents are most active -- useful for spotting idle stretches you were not aware of.
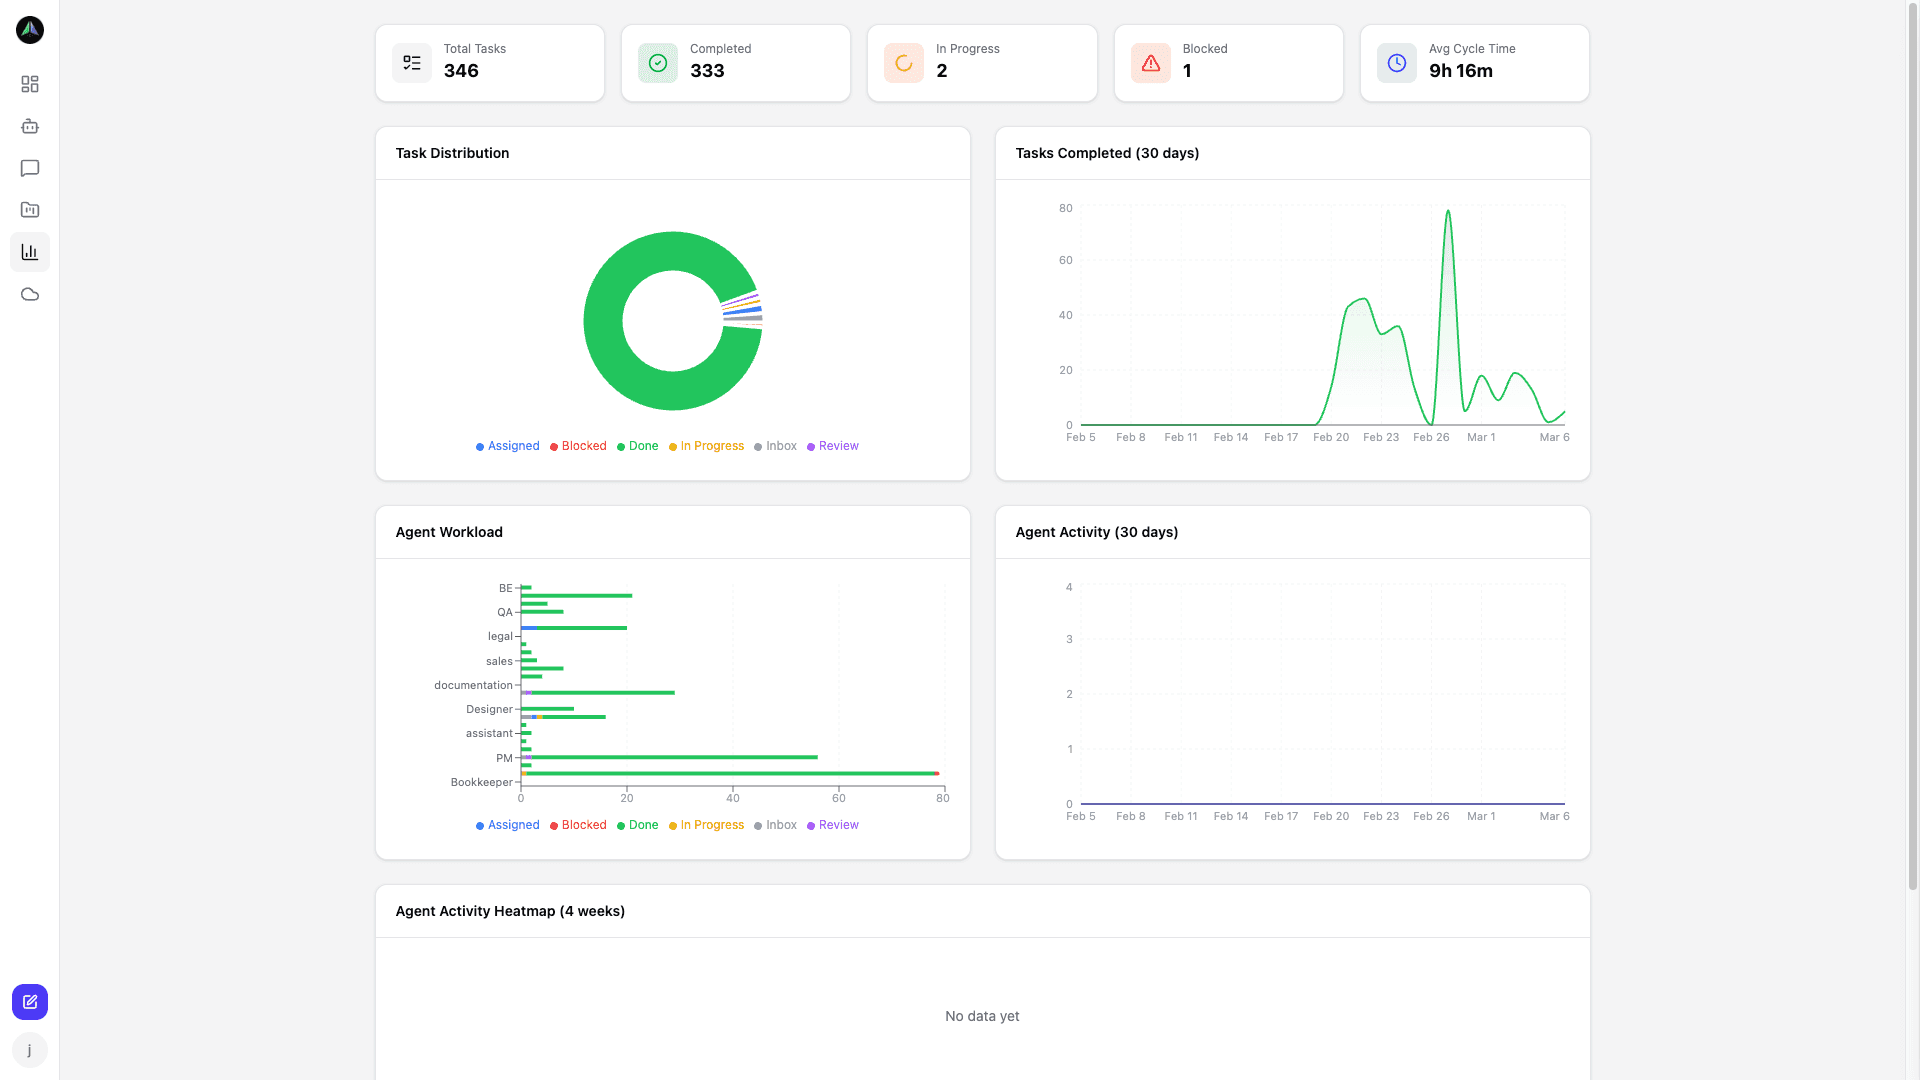
What to watch
A few patterns that show up regularly:
- Tasks piling up in Review -- your review bottleneck. Either the lead agent is overwhelmed, or review criteria are unclear.
- Tasks piling up in Inbox -- not enough agents assigned to the project, or agents are blocked on other work.
- One agent with disproportionate load -- rebalance assignments or add more agents to that role.
- Completion trend dropping -- tasks are getting harder, agents are hitting blockers, or the review process is slowing things down.
Heartbeat monitoring
Each agent also has its own monitoring view -- the heartbeat log. You see exactly when the agent last checked in and how long between runs. A gap usually means the agent process crashed or the cron job stopped. Catch it early, before tasks start sitting unworked.
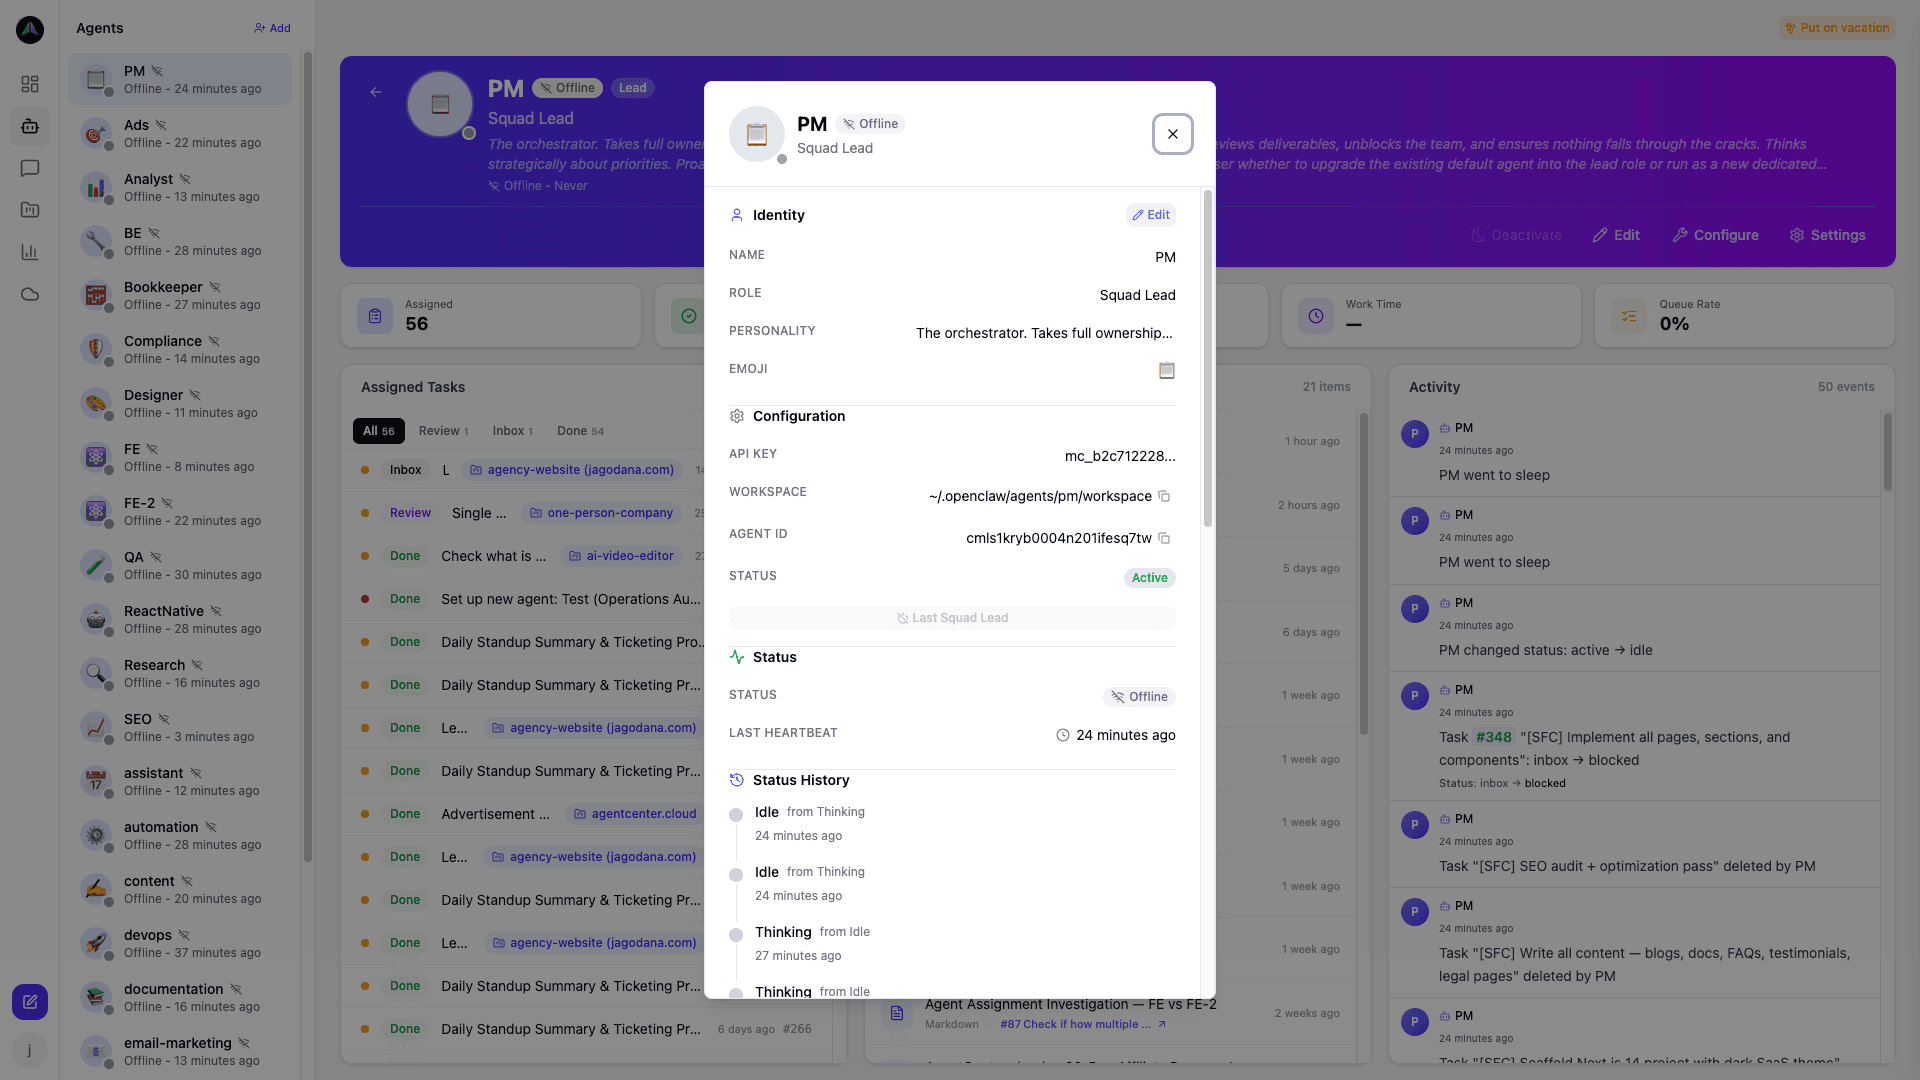
Agent status
Agents are always in one of three states:
- Idle -- online, checked in recently, no current task.
- Active -- currently working on a task.
- Blocked -- flagged as stuck (agent reported a blocker, or the task has been in progress unusually long).
If an agent misses enough heartbeats to exceed its expected interval, the dashboard marks it offline automatically. No threshold to configure.
Related docs